Is Andover tap water safe to drink?
- Andover
The short answer for Andover
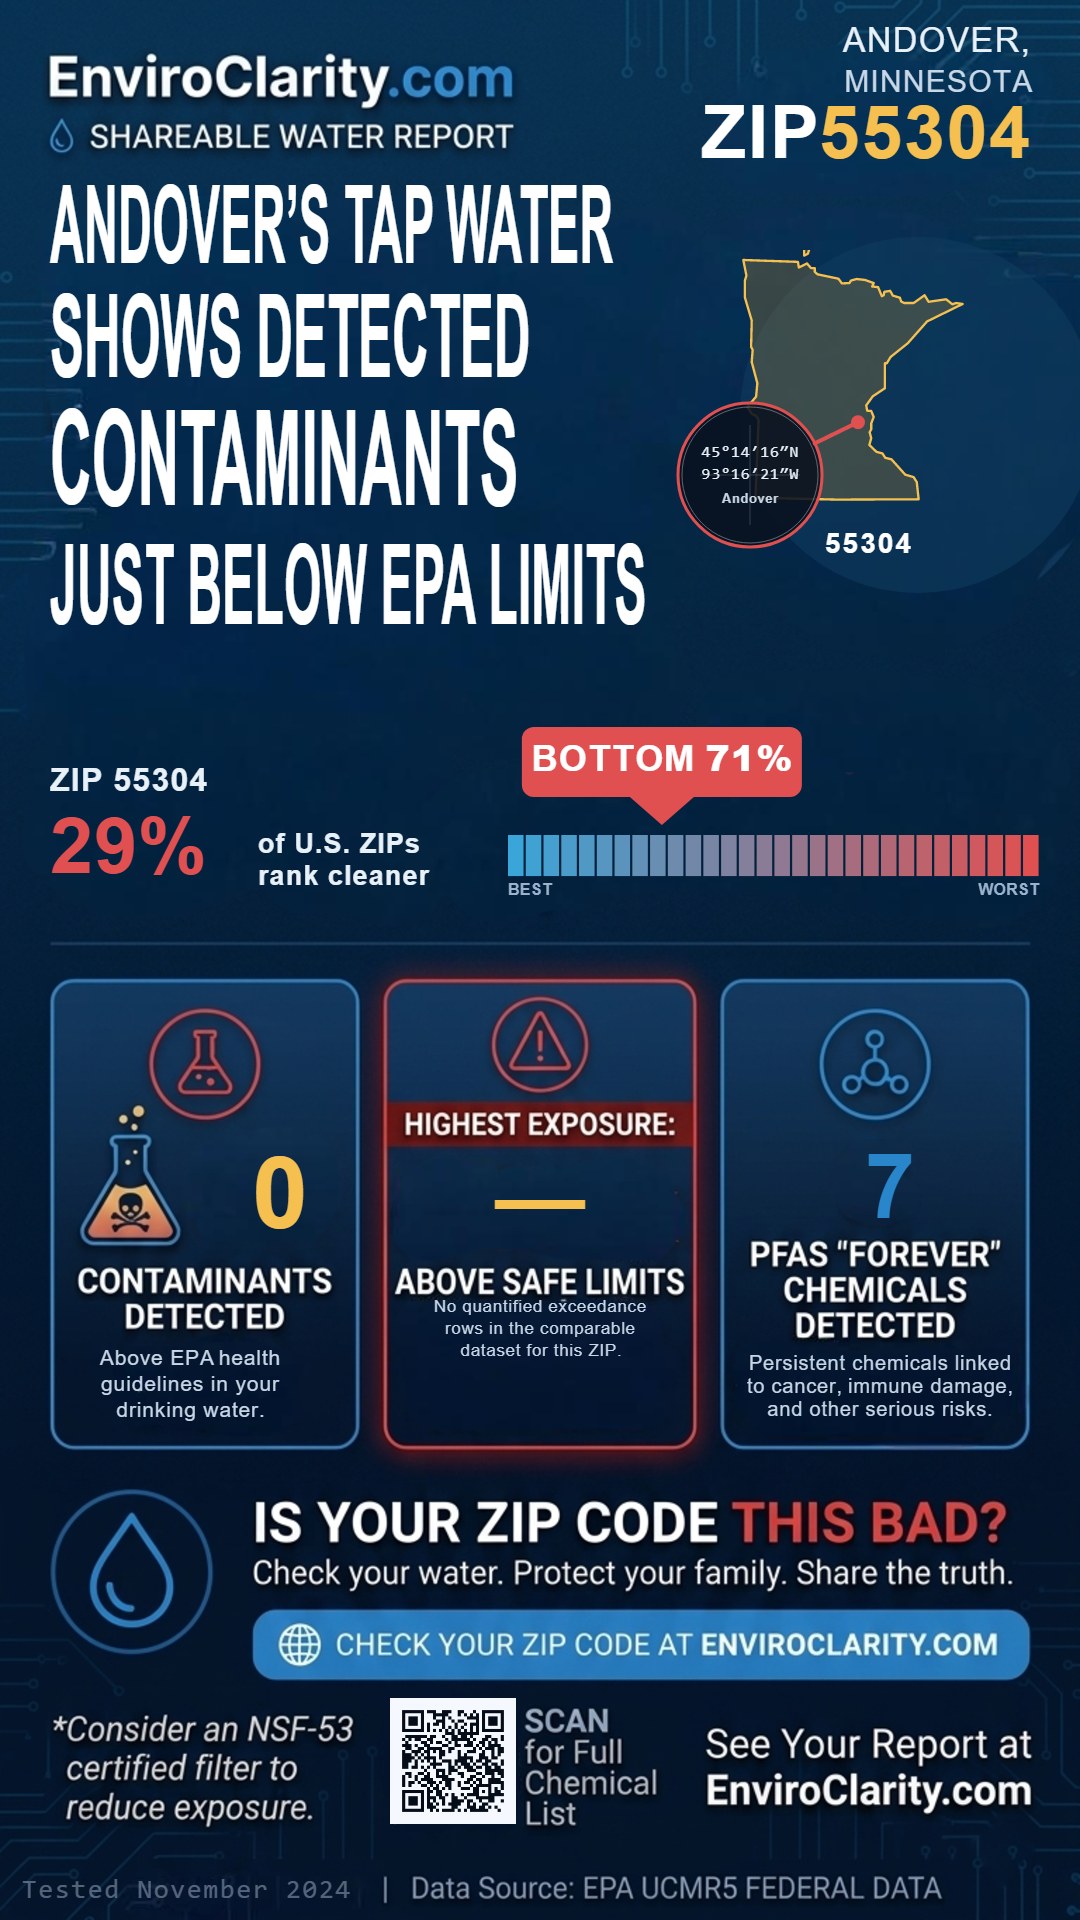
Andover tap water has 12 detected contaminants, currently below EPA limits (tested November 2024). 4:2 FTS measured closest to the threshold. See the full compound-by-compound report.
The health risk for Andover
- PFAS or other chemicals detected; no confirmed exceedances in multiple samples.
4:2 FTS (a PFAS 'forever chemical') was detected below EPA limits. A certified filter can still add an extra layer of protection.
Here's what actually removes PFAS from your water
The right filter eliminates PFAS at the tap. But not all filters do - and the type you choose matters for your home.
Common pitchers like Brita do not remove PFAS. You need a filter independently certified to NSF P473 (for pitcher filters) or NSF/ANSI 58 (for reverse osmosis systems). All three options below carry the relevant certification.
| Compound | Measurement | EPA Limit | Comparison |
|---|---|---|---|
| 4:2 FTS Tested: November 2024 · Well #2 Entry Point |
0.003 µg/L | 0.003 µg/L | 100% of limit |
| lithium Tested: November 2024 · Well #2 Entry Point |
9.600 µg/L | 10 µg/L | 96% of limit |
View all tested compounds
785069 · Tested: Multiple dates
| Compound | Measurement | EPA Limit | Comparison |
|---|---|---|---|
| Perfluorooctanoic acid | 1.070 ng/L | 4 ng/L | 27% of limit |
| Arsenic | 1.480 µg/L | 10 µg/L | 15% of limit |
| Perfluorobutanesulfonic acid | 0.419 ng/L | 3 ng/L | 14% of limit |
| Perfluoropentanesulfonic acid | 0.434 ng/L | 4 ng/L | 11% of limit |
| Perfluorohexanesulfonic acid | 0.166 ng/L | 10 ng/L | 2% of limit |
| Chromium | 1.540 µg/L | 100 µg/L | 2% of limit |
| Copper | 15.600 µg/L | 1300 µg/L | 1% of limit |
| Nitrate + Nitrite | 3.000 mg/L | 1E+04 mg/L | 0.0% of limit |
| Perfluorohexanoic acid | 0.339 ng/L | 3000 ng/L | 0.0% of limit |
| 4,4'-Isopropylidenediphenol | 3.720 ng/L | — | — |
| Alkalinity, total | 17.600 mg/L | — | — |
| Aluminum | 890.000 µg/L | — | — |
| Barium | 17.300 µg/L | — | — |
| Bromide | 0.015 mg/L | — | — |
| Cadmium | 0.210 µg/L | — | — |
| Calcium | 2.770 mg/L | — | — |
| Chloride | 21.600 mg/L | — | — |
| Cobalt | 1.910 µg/L | — | — |
| Iron | 4450.000 µg/L | — | — |
| Kjeldahl nitrogen | 0.925 mg/L | — | — |
| Magnesium | 23.600 mg/L | — | — |
| Manganese | 65.600 µg/L | — | — |
| Metformin | 1.050 ng/L | — | — |
| Molybdenum | 1.480 µg/L | — | — |
| N,N-Diethyl-m-toluamide | 4.730 ng/L | — | — |
| Nickel | 1.600 µg/L | — | — |
| Organic carbon | 6.100 mg/L | — | — |
| Penicillin G | 5.660 ng/L | — | — |
| Perfluorobutanoate | 6.260 ng/L | — | — |
| Perfluorooctane sulfonic acid | 1.180 ng/L | — | — |
| Perfluorovaleric acid | 0.345 ng/L | — | — |
| Phosphorus | 0.168 mg/L | — | — |
| Potassium | 0.520 mg/L | — | — |
| Sodium | 24.500 mg/L | — | — |
| Strontium | 27.200 µg/L | — | — |
| Sulfate | 4.730 mg/L | — | — |
| Titanium | 11.300 µg/L | — | — |
| Tributyl phosphate | 1.740 ng/L | — | — |
| Triethyl phosphate | 1.210 ng/L | — | — |
| Triphenyl phosphate | 1.020 ng/L | — | — |
| Tris(1,3-dichloro-2-propyl)... | 2.940 ng/L | — | — |
| Tris(1-chloro-2-propyl) pho... | 4.630 ng/L | — | — |
| Tris(2-butoxyethyl) phosphate | 59.800 ng/L | — | — |
| Tris(2-chloroethyl) phosphate | 4.220 ng/L | — | — |
| Vanadium | 6.390 µg/L | — | — |
TREATMENT PLANT #1 · Tested: November 2024
| Compound | Measurement | EPA Limit | Comparison |
|---|---|---|---|
| PFBA | 0.011 µg/L | 6 µg/L | 0.2% of limit |
| lithium | <9.000 µg/L | 10 µg/L | Below limit |
| PFHxS | <0.003 µg/L | 0.004 µg/L | Below limit |
| HFPO-DA | <0.005 µg/L | 0.01 µg/L | Below limit |
| PFNA | <0.004 µg/L | 0.01 µg/L | Below limit |
| PFHxA | <0.003 µg/L | 3 µg/L | Below limit |
| 11Cl-PF3OUdS | <0.005 µg/L | 0.005 µg/L | Below limit |
| 4:2 FTS | <0.003 µg/L | 0.003 µg/L | Below limit |
| 6:2 FTS | <0.005 µg/L | 0.005 µg/L | Below limit |
| 8:2 FTS | <0.005 µg/L | 0.005 µg/L | Below limit |
| 9Cl-PF3ONS | <0.002 µg/L | 0.002 µg/L | Below limit |
| ADONA | <0.003 µg/L | 0.003 µg/L | Below limit |
| PFBS | <0.003 µg/L | 0.003 µg/L | Below limit |
| PFDA | <0.003 µg/L | 0.003 µg/L | Below limit |
| PFDoA | <0.003 µg/L | 0.003 µg/L | Below limit |
| PFHpA | <0.003 µg/L | 0.003 µg/L | Below limit |
| PFHpS | <0.003 µg/L | 0.003 µg/L | Below limit |
| PFOA | <0.004 µg/L | 0.004 µg/L | Below limit |
| PFOS | <0.004 µg/L | 0.004 µg/L | Below limit |
| PFPeA | <0.003 µg/L | 0.003 µg/L | Below limit |
| PFTrDA | <0.007 µg/L | 0.007 µg/L | Below limit |
| PFUnA | <0.002 µg/L | 0.002 µg/L | Below limit |
Well #2 Entry Point · Tested: November 2024
| Compound | Measurement | EPA Limit | Comparison |
|---|---|---|---|
| 4:2 FTS | 0.003 µg/L | 0.003 µg/L | 100% of limit |
| lithium | 9.600 µg/L | 10 µg/L | 96% of limit |
| PFHxS | <0.003 µg/L | 0.004 µg/L | Below limit |
| HFPO-DA | <0.005 µg/L | 0.01 µg/L | Below limit |
| PFNA | <0.004 µg/L | 0.01 µg/L | Below limit |
| PFHxA | <0.003 µg/L | 3 µg/L | Below limit |
| PFBA | <0.005 µg/L | 6 µg/L | Below limit |
| 11Cl-PF3OUdS | <0.005 µg/L | 0.005 µg/L | Below limit |
| 4:2 FTS | <0.003 µg/L | 0.003 µg/L | Below limit |
| 6:2 FTS | <0.005 µg/L | 0.005 µg/L | Below limit |
| 8:2 FTS | <0.005 µg/L | 0.005 µg/L | Below limit |
| 9Cl-PF3ONS | <0.002 µg/L | 0.002 µg/L | Below limit |
| ADONA | <0.003 µg/L | 0.003 µg/L | Below limit |
| PFBS | <0.003 µg/L | 0.003 µg/L | Below limit |
| PFDA | <0.003 µg/L | 0.003 µg/L | Below limit |
| PFDoA | <0.003 µg/L | 0.003 µg/L | Below limit |
| PFHpA | <0.003 µg/L | 0.003 µg/L | Below limit |
| PFHpS | <0.003 µg/L | 0.003 µg/L | Below limit |
| PFOA | <0.004 µg/L | 0.004 µg/L | Below limit |
| PFOS | <0.004 µg/L | 0.004 µg/L | Below limit |
| PFPeA | <0.003 µg/L | 0.003 µg/L | Below limit |
| PFTrDA | <0.007 µg/L | 0.007 µg/L | Below limit |
| PFUnA | <0.002 µg/L | 0.002 µg/L | Below limit |
Well #3 Entry Point · Tested: November 2024
| Compound | Measurement | EPA Limit | Comparison |
|---|---|---|---|
| lithium | <9.000 µg/L | 10 µg/L | Below limit |
| PFHxS | <0.003 µg/L | 0.004 µg/L | Below limit |
| HFPO-DA | <0.005 µg/L | 0.01 µg/L | Below limit |
| PFNA | <0.004 µg/L | 0.01 µg/L | Below limit |
| PFHxA | <0.003 µg/L | 3 µg/L | Below limit |
| PFBA | <0.005 µg/L | 6 µg/L | Below limit |
| 11Cl-PF3OUdS | <0.005 µg/L | 0.005 µg/L | Below limit |
| 4:2 FTS | <0.003 µg/L | 0.003 µg/L | Below limit |
| 6:2 FTS | <0.005 µg/L | 0.005 µg/L | Below limit |
| 8:2 FTS | <0.005 µg/L | 0.005 µg/L | Below limit |
| 9Cl-PF3ONS | <0.002 µg/L | 0.002 µg/L | Below limit |
| ADONA | <0.003 µg/L | 0.003 µg/L | Below limit |
| PFBS | <0.003 µg/L | 0.003 µg/L | Below limit |
| PFDA | <0.003 µg/L | 0.003 µg/L | Below limit |
| PFDoA | <0.003 µg/L | 0.003 µg/L | Below limit |
| PFHpA | <0.003 µg/L | 0.003 µg/L | Below limit |
| PFHpS | <0.003 µg/L | 0.003 µg/L | Below limit |
| PFOA | <0.004 µg/L | 0.004 µg/L | Below limit |
| PFOS | <0.004 µg/L | 0.004 µg/L | Below limit |
| PFPeA | <0.003 µg/L | 0.003 µg/L | Below limit |
| PFTrDA | <0.007 µg/L | 0.007 µg/L | Below limit |
| PFUnA | <0.002 µg/L | 0.002 µg/L | Below limit |
Water utilities serving ZIP 55304
Service area boundaries are approximate and based on state filings or modeled estimates. Contact your utility to confirm exact service at a specific address.
- ANDOVERSome concern
Frequently Asked Questions about ZIP 55304 Tap Water
What's in ZIP 55304 tap water?
ZIP 55304 has 12 detected contaminants below EPA limits in this dataset. 4:2 FTS measured closest to its guideline.
Will boiling ZIP 55304 tap water remove 4:2 FTS?
Boiling tap water can kill many pathogens, but it does not remove most chemical contaminants tracked in EPA monitoring. Several dissolved contaminants can even concentrate as water evaporates. For the chemical contaminants reported in ZIP 55304, a certified filter is more reliable.
Do basic pitcher filters remove 4:2 FTS?
Basic pitcher filters are typically rated for chlorine, taste, and odor (NSF/ANSI 42), not for the broader list of contaminants tracked in EPA monitoring. Match the certification (NSF/ANSI 42, 53, 58, or P473) to the specific compounds listed in this report before assuming a filter helps.
Who provides tap water in ZIP 55304?
Public records identify ANDOVER as a primary water system associated with ZIP 55304. Service boundaries can vary by address, so confirm exact service with the utility.
When was ZIP 55304 tap water last tested?
The most recent test date used in this report is November 2024. EnviroClarity last refreshed this page on 2026-05-05.
Where can I find the official water quality report for ZIP 55304?
Every U.S. public water system is required to publish an annual Consumer Confidence Report (CCR). Contact ANDOVER or visit their website for the latest official report covering ZIP 55304. The EPA also maintains a national CCR locator.
Check another ZIP code
Nearby ZIP reports
- 55448 - Minneapolis, Coon Rapids tap water report
- 55434 - Minneapolis, Blaine tap water report
- 55433 - Minneapolis, Coon Rapids tap water report
- 55449 - Minneapolis, Blaine tap water report
- 55316 - Champlin tap water report
- 55011 - Cedar, East Bethel tap water report
- 55303 - Ramsey tap water report
- 55444 - Minneapolis, Brooklyn Park tap water report
Data reflects publicly reported utility records from EPA datasets and local utility disclosures. This information is educational and not medical advice.